10 Dividing Lines: Understanding Kamloops Neighbourhood Unemployment Rates
Panagiotis Tsigaris
Introduction
This research studies the unemployment rates across 24 neighbourhoods in Kamloops. It provides a lens through which we can understand the socioeconomic and demographic dynamics of the region. Kamloops, a city with a 100,000 population in the interior of British Columbia and with diverse neighbourhoods, may also have a divergence in the unemployment rates across the neighbourhoods that depend on socioeconomic and demographic characteristics (Wheeler, 2007). This research examines the unemployment rates across these distinct neighbourhoods in Kamloops, seeking to uncover the socioeconomic and demographic factors that influence these rates. Finally, recommendations to reduce the unemployment rate in high-unemployment regions are offered.
Literature Review
The demographic composition of each neighbourhood often plays a key role in shaping the unemployment rates (Vandecasteele & Fasang, 2020; Schachner, 2021). Age demographics, educational attainment, family status, ethnic diversity, and immigration are key demographic factors that may significantly impact employment opportunities (DeLamatre, 1996; Vandecasteele & Fasang, 2020). For example, areas with a higher concentration of young adults might experience different unemployment trends compared to neighbourhoods predominantly inhabited by retirees or families (Dujardin et al., 2008).
Evidence consistently shows that lower educational attainments (e.g., not completing high school) correlate with higher unemployment rates (Daly et al., 2007; Butkus et al., 2020; McDonnall & Tatch, 2021). Butkus et al. (2020) highlight that individuals with lower educational levels are more vulnerable to economic downturns, leading to increased unemployment rates during such periods. Wheeler’s (2007) evidence indicates that regionalization of unemployed people in U.S. cities increased from 1980 to 2000, even while the national unemployment rate declined. Residential communities in urban areas nationwide were segregated by the unemployment rate. Economic and educational social stratification within a city may explain this tendency. These studies imply that preventing high school dropouts through better educational infrastructure could lower unemployment.
Giorgio and Habibis (2018) find that Indigenous unemployment is three times greater than non-Indigenous unemployment. Ethnic minorities have a greater unemployment rate than white British people (Longhi, 2018). Frictional markets and ethnic unemployment rates have also been studied, showing that geographical mismatch affects ethnic unemployment (Gobillon et al., 2013). Research has shown a higher rate of unemployment for single-parent households in London (Stafford, 2004). Additionally, adverse childhood experiences, including single parenthood, have been significantly associated with unemployment among adults (Liu et al., 2012). Furthermore, economic security among working households, particularly single-parent households, shows a slower economic recovery from the 2008 recession in the U.S. (Chang, 2020).
Furthermore, local industry and employment opportunities available in each neighbourhood are important determinants. The presence of major employers, the diversity of industries, and the availability of jobs within commuting distance can greatly influence the unemployment rate. Some neighbourhoods may benefit from proximity to industrial hubs or commercial centres (Alva et al., 2021; Sonn & Kim, 2020). Socioeconomic factors such as income segregation, housing affordability, and access to transportation can also affect unemployment rates. Neighbourhoods segregated by income and inadequate public transportation can face higher unemployment due to the difficulty residents face in accessing job markets’ employment opportunities.
Areas with inadequate public transportation may limit the mobility of workers to find jobs in other jurisdictions. Public transportation decreases neighbourhood unemployment as users need access to search for jobs in other city regions (Tyndall, 2017; Yi, 2006). Ong and Houston (2002) found that transportation somewhat enhances job chances for single women on assistance in Los Angeles County. Boschmann (2011) highlighted poor public transit affects poor workers’ mobility and employment across regions. These findings suggest that transportation policy should be adapted to different population segments’ mobility demands to improve work accessibility and eliminate employment disparities.
In this chapter, we use the census databases to explore the neighbourhood unemployment rate in Kamloops, a city in the interior of British Columbia, and the factors that influence the divergence in unemployment rates based on the above literature review. The next section presents the methodology followed by results and ends with a discussion and conclusion.
Theory
Being unemployed means a person does not have a job or formal employment but is actively seeking work. It is a state in which individuals who are capable and willing to work cannot find job opportunities. Unemployment can affect one’s financial stability and emotional well-being, often leading to stress and a sense of uncertainty about the future. The reasons for unemployment can vary widely, including economic downturns, industry shifts, technological changes, or personal circumstances. Beyond its economic impact, unemployment can also influence social relations and self-esteem, as work often provides a sense of purpose and identity.
Bathtub Model of Unemployment
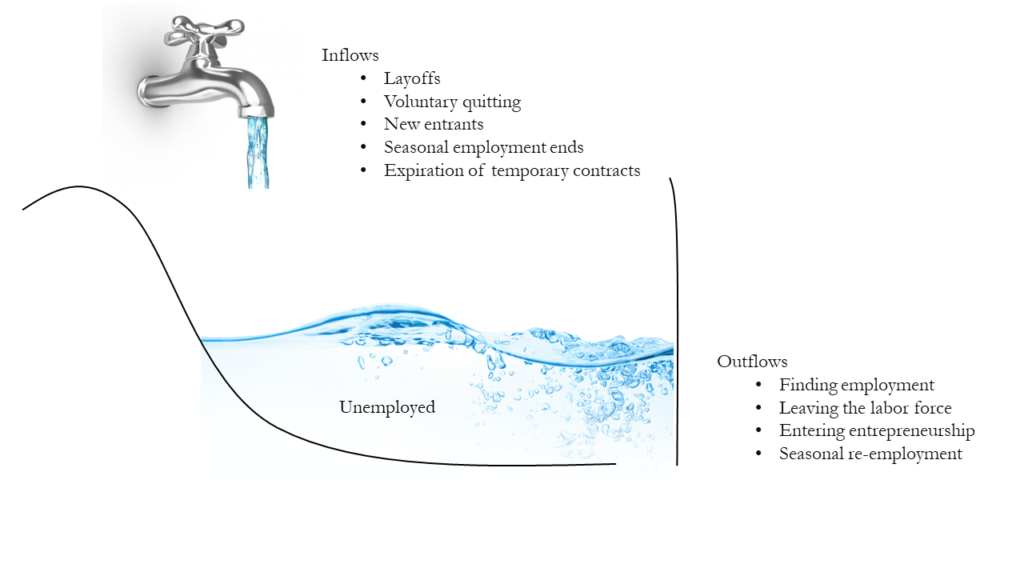
The “bathtub analogy” offers a clear visualization of the dynamics within the labour market and the unemployed. In this analogy, the unemployed population is likened to the water in a bathtub. The inflows — such as layoffs, voluntary quitting, new entrants into the workforce, the end of seasonal employment, and the expiration of temporary contracts — act like water flowing from a faucet, increasing the level of water in the tub. Conversely, the outflows include finding employment, leaving the labour force often due to discouragement, entering into entrepreneurship, and obtaining seasonal re-employment, which are akin to the water draining out, reducing the level of water in the tub (see Figure 1).

An equilibrium unemployment rate occurs when the volume of inflows is equal to the volume of outflows. If inflows exceed outflows, the water level — or the number of unemployed — rises, leading to a higher unemployment rate. Over time, the unemployment rate will find a new equilibrium at an elevated level when the inflows and outflows eventually balance each other once more. Conversely, if outflows exceed inflows, the unemployment rate decreases as more individuals leave the unemployment pool than enter it. This dynamic visualization helps in understanding how various factors contribute to changes in the unemployment rate over time.
Divergence From Theoretical Model
In an ideal world with a labour market that is fully integrated, unemployment rates will be similar across different regions. In areas where unemployment is high, individuals would relocate to regions with better employment opportunities. This migration would naturally lead to a long-term convergence of unemployment rates, as high-unemployment regions would see a decrease due to out-migration, and low-unemployment areas would experience a slight increase due to an influx of new labour. However, reality often diverges from this theoretical model. Instead of moving to areas with better job prospects, individuals in high-unemployment regions might not be able to migrate, preventing the anticipated equilibrium. This suggests that there are underlying causes and barriers — possibly including socioeconomic conditions and systemic segregation — that inhibit the free movement of labour and the equalization of unemployment rates across regions. Such factors highlight the complexity of labour market dynamics and the challenges in achieving truly integrated employment sectors (see Figure 2).

Methodology
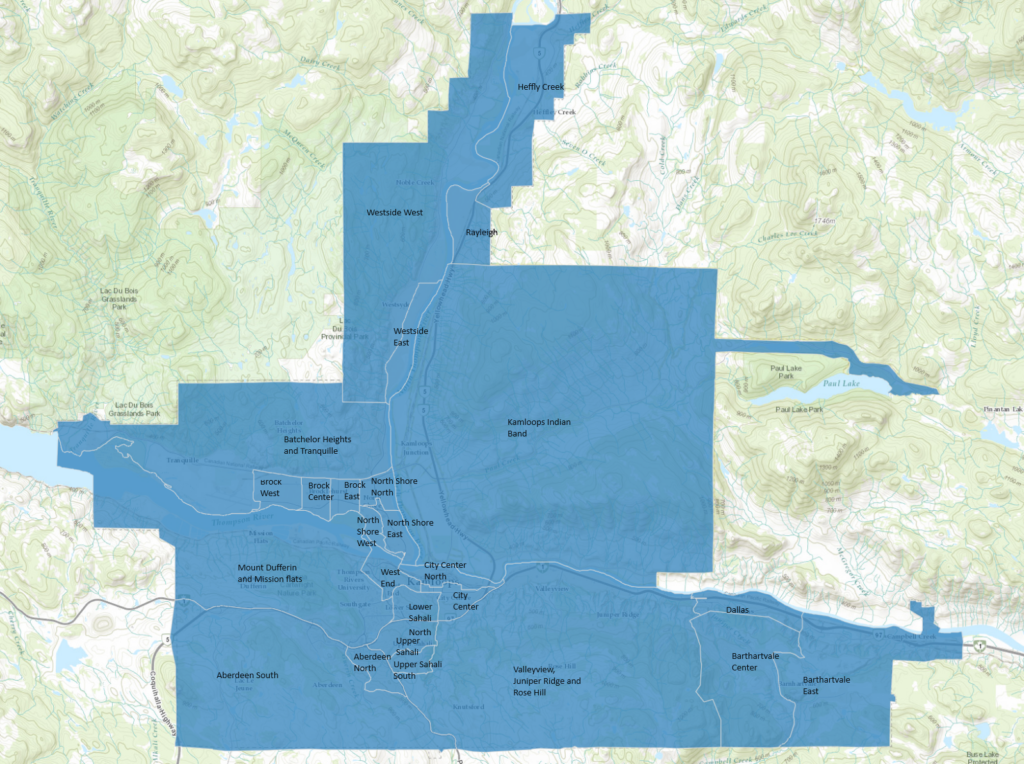
Data was obtained from the City of Kamloops Open Data Catalog. Census tracks 2011, 2016, and 2021 were used to study the factors that influence neighbourhood unemployment rates across 24 districts in Kamloops. These neighbourhoods are Aberdeen (north and south), Barnhartvale (centre and east), Barthelor Heights/Tranquille, Brocklehurst (centre, east and west), City Centre (north and south), Dallas, Heffley Creek, Lower Sahali, Mount Dufferin/Mission Flats, North Shore (east, north and west), Rayleigh, Upper Sahali (north and south), Valleyview/Juniper Ridge/Rose hill, West End, and Westsyde (east and west). Figure 2 shows all Kamloops neighbourhoods on a map.
Determining Neighbourhood Socioeconomic Status
The socioeconomic status of the 24 districts was determined by five different factors. The variables give information about each neighbourhood’s socioeconomic condition. The variables selected for this study are the median after-tax income per person adjusted for inflation (RINC). This is used to indicate the standard of living of the district. The other variables are the percentage of students not completing high school in the district (NOEDU12), the percentage of single-parent families (FAM1PKIDS), and the employment rate of the district (EMPL). Since these variables were found to be highly correlated, they tend to move together; for example, neighbourhoods with a higher percentage of single-parent families might also have lower median income or higher percentages of the population without a high school diploma. Because these variables are so intertwined, the study uses the principal component analysis (PCA). The principal component was created using the inverse of RINC and that of EMPL (i.e., /INC, 1/EMPL) with NOEDU12, FAM1PKIDS to convert all the correlations to be positive.
PCA helps by combining these variables into a smaller number of ‘components.’ These components are like new, simplified variables that still carry most of the important information from the original five. It is like creating a summary of a long story — but keeps the key points and leaves out the repetitive details. From PCA, one principal component was created since it contained a significant amount of information about the neighbourhood. This new variable is a mix of the original variables but in a way that captures the most important information from all of them. Finally, the unemployment rate of each district is linked to the socioeconomic state of the neighbourhood as per the PCA to make policy recommendations to reduce the unemployment rate in regions with high unemployment.

Results & Discussion
Table 1 shows the key variables. The average annual unemployment rate across the 24 neighbourhoods from 2010 to 2020 was 8%, with a high variability ranging from the lowest unemployment at 2.6% and highest at 19%. The employment rate averaged 60% of the population aged 15 plus also shows a significant variability, as a significant number of single parents average 15.8% across all neighbourhoods, with the highest level at 33% of all parents with children. Students that have not completed high school are also significantly high, averaging 16% across all neighbourhoods for the decade, with some neighbourhoods having a dropout rate of 30%. The median after-tax income of a person also shows a wide variation whereby the richest neighbourhood has a standard of living of $50,105, which is twice as much as the poorest neighbourhood living at $23,877. These preliminary results show evidence that the community is highly segregated.
Table 1: Descriptive Statistics of Socioeconomic & Demographic Variables From Kamloops’ 24 Neighbourhoods
| Skip Table 1 | ||||
| Variable | Mean | Standard Deviation | Min | Max |
|---|---|---|---|---|
| Unemployment Rate (%) | 8.0 | 2.8 | 2.6 | 19 |
| Employment Rate (%) | 58.9 | 6.4 | 40 | 71 |
| Single Parent (%) | 15.8 | 6.6 | 0 | 33 |
| Less Than Grade 12 Education (%) | 16.0 | 5.0 | 8 | 30 |
| After Tax Median Income ($) | $38,716 | $6,088 | $23,877 | $50,105 |
Table 2 shows the correlation matrix of the main variables that characterize a neighbourhood. All correlations are very high. Correlation does not show causation. However, it makes it very difficult to determine the individual impact these variables have on the unemployment rates of the 25 neighbourhoods. Hence, the aggregation of these variables into one variable, namely a principal component. The highest correlation is bewteen income and employment rates of the neighbourhoods at 0.70 however, income is also highly negatively correlated with the dropout rate from high school and the percentage rate of single parents in the neighbourhoods.
Table 2: Pearson Correlation Matrix, 2010–2015–2020
| Skip Table 2 | |||||
| Variables | RINC | EDULESS12 | P1KIDS | EMLP | UN |
|---|---|---|---|---|---|
| RINC | 1.000 | — | — | — | — |
| EDULESS12 | -0.685 | 1.000 | — | — | — |
| P1KIDS | -0.685 | 0.695 | 1.000 | — | — |
| EMLP | 0.703 | -0.653 | -0.483 | 1.000 | — |
| UN | -0.577 | 0.433 | 0.439 | -0.555 | 1.000 |
Note: All correlations have p-values <0.001.
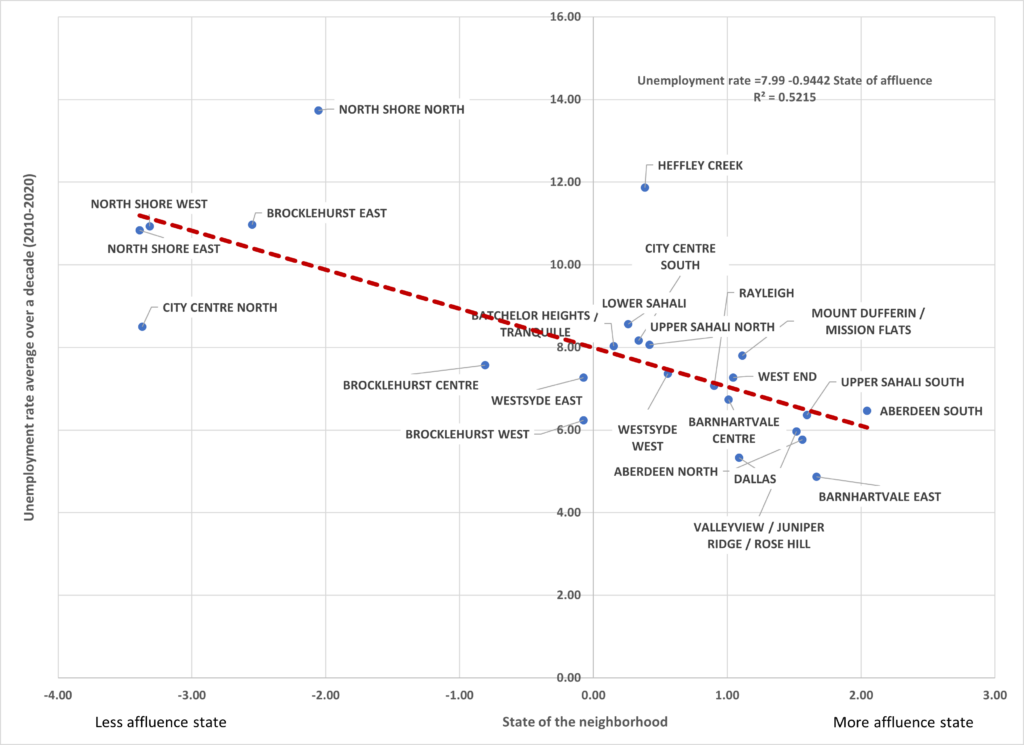
The principal component capturing all these socioeconomic characteristics of the neighbourhood ranged from the value of -4, showing poor socioeconomic neighbourhoods, to +4 with the more affluent neighbourhoods. Figure 4 shows a strong negative association between the state of the neighbourhood and the unemployment rate of the region. In fact, a 1-unit improvement in the socioeconomic status of the neighbourhood will reduce the unemployment rate in the neighbourhood by 1%. Less affluent neighbourhoods like those on the North Shore have a persistent higher unemployment rate than those on the South Shore. Many unemployment rates are around the average of 8%. This is a clear divide and a segregated community that requires attention by the municipal governance.

Conclusion
This longitudinal study investigates the unemployment rates across 24 neighbourhoods in Kamloops, employing census data from 2011, 2016, and 2021 to identify socioeconomic and demographic determinants. Key findings highlight the important role of educational attainment, family structure, and transportation accessibility in influencing local unemployment dynamics. Notably, systemic barriers such as income segregation and inadequate public transportation exacerbate disparities, hindering the free movement of labour and perpetuating segmented labour markets contrary to theoretical expectations of an integrated labour market. The policy recommendations arising from this study include enhancing educational infrastructures to reduce high school dropout rates, improving public transportation systems to facilitate access to employment opportunities, allocating funds to build a better infrastructure which can accommodate more retail firms in the North Shore’s business district where the unemployment rate is higher than other regions, and introduce targeted employment initiatives to support vulnerable groups such as single-parent households (i.e., free daycare), ethnic minorities and young Indigenous people looking for work. Such policies are aimed at fostering a more inclusive and integrated labour market.
Despite its comprehensive approach, this study has limitations inherent in analyzing complex socioeconomic interactions through principal component analysis, which might simplify the relationships between multiple factors and unemployment. Also, the study shows correlation and not cause and effect. Future research should continue to utilize longitudinal data to dissect these relationships more deeply, possibly incorporating more granular, neighbourhood-level economic and policy variables to further explore the causal pathways affecting unemployment trends in Kamloops.

Media Attributions
Figure 1: “The unemployment bathtub analogy” by the author is under a CC BY-NC-SA 4.0 license.
Figure 2: “Convergence versus divergence of unemployment rates in the neighbourhoods of Kamloops flowchart” by the author is under a CC BY-NC-SA 4.0 license.
Figure 3: “25 Neighbourhoods in Kamloops” by the City of Kamloops (n.d.) is used under the Open Government Licence – Kamloops.
Figure 4: “An association between the state of the neighbourhood and the unemployment rate in the various neighbourhoods in over a decade graph” by the author is under a CC BY-NC-SA 4.0 license.
Figure 5: “Panagiotis Tsigaris’ poster presentation at the 19th Undergraduate Research Conference during March 2024” by the author is under a CC BY-NC-SA 4.0 license.
References
Alva, F., Boever, R., & Eetvelde, G. (2021). Hubs for circularity: Geo-based industrial clustering towards urban symbiosis in Europe. Sustainability, 13(24), Article No. 13906. https://doi.org/10.3390/su132413906
Blatná, D. (2019). Analysis of the relationship between unemployment rate, education level and selected economic indicators in the Czech Republic 2005-2017. Proceedings of the 13th International Days of Statistics and Economics, Czech Republic. https://doi.org/10.18267/pr.2019.los.186.15
Boschmann, E. (2011). Job access, location decision, and the working poor: A qualitative study in the Columbus, Ohio metropolitan area. Geoforum, 42(6), 671–682. https://doi.org/10.1016/j.geoforum.2011.06.005
Butkus, M., Matuzevičiūte, K., Ruplienė, D., & Seputiene, J. (2020). Does unemployment responsiveness to output change depend on age, gender, education, and the phase of the business cycle? Economies, 8(4), Article No. 98. https://doi.org/10.3390/economies8040098
Chang, Y. (2020). Does state unemployment insurance modernization explain the trajectories of economic security among working households? Longitudinal evidence from the 2008 survey of income and program participation. Journal of Family and Economic Issues, 41, 200–217. https://doi.org/10.1007/s10834-020-09661-4
Daly, M., Jackson, O., & Valletta, R. (2007). Educational attainment, unemployment, and wage inflation. In A. Todd (Ed.), Econometric review 2007. Federal Reserve Bank of San Francisco.
DeLamatre, M. (1996). Investigating the antecedents of youth unemployment: Individual, family, and neighborhood factors (Publication No. 6330) [Doctoral dissertation, Louisiana State University and Agricultural & Mechanical College]. LSU Historical Dissertations and Theses. https://doi.org/10.31390/gradschool_disstheses.6330
Dujardin, C., Selod, H., & Thomas, I. (2008). Residential segregation and unemployment: The case of Brussels. Urban Studies, 45(1), 89–113. https://doi.org/10.1177/0042098007085103
Giorgio, A., & Habibis, D. (2018). Governing pluralistic liberal democratic societies and Metis knowledge: the problem of Indigenous unemployment. Journal of Sociology, 55(1), 37–53. https://doi.org/10.1177/1440783318766676
Gobillon, L., Rupert, P., & Wasmer, É. (2013). Ethnic unemployment rates and frictional markets. IZA Institute of Labor Economics Discussion Paper Series, Article No. 7448. https://doi.org/10.2139/ssrn.2283563
Liu, Y., Croft, J. B., Chapman, D. P., Perry, G. S., Greenlund, K. J., Zhao, G., & Edwards, V. J. (2012). Relationship between adverse childhood experiences and unemployment among adults from five US states. Social Psychiatry and Psychiatric Epidemiology, 48, 357–369. https://doi.org/10.1007/s00127-012-0554-1
Longhi, S. (2018). A longitudinal analysis of ethnic unemployment differentials in the UK. Journal of Ethnic and Migration Studies, 46(5), 879–892. https://doi.org/10.1080/1369183x.2018.1539254
Markaki, Y., & Longhi, S. (2013). What determines attitudes to immigration in European countries? An analysis at the regional level. Migration Studies, 1(3), 311–337. https://doi.org/10.1093/migration/mnt015
McDonnall, M. C., & Tatch, A. (2021). Educational attainment and employment for individuals with visual impairments. Journal of Visual Impairment & Blindness, 115(2), 152–159. https://doi.org/10.1177/0145482X211000963
Ong, P., & Houston, D. (2002). Transit, employment and women on welfare. Urban Geography, 23(4), 344–364. https://doi.org/10.2747/0272-3638.23.4.344
Partridge, M. D., & Rickman, D. S. (1995). Differences in state unemployment rates: The role of labor and product market structural shifts. Southern Economic Journal, 62(1), 89–106. https://doi.org/10.2307/1061378
Sonn, J. W., & Kim, S. H. (2020). 33 location choice for industrial complexes in South Korea. In A. Oqubay, & J. Y. Lin, The Oxford handbook of industrial hubs and economic development. Oxford University Press.
Schachner, J. N. (2021). Neighborhood economic change in an Era of metropolitan divergence. Urban Affairs Review, 58(4), 923–959. http://doi.org/10.1177/10780874211016940
Stafford, M., Martikainen, P., Lahelma, E., & Marmot, M. (2004). Neighbourhoods and self rated health: A comparison of public sector employees in London and Helsinki. Journal of Epidemiology & Community Health, 58(9), 772–778. https://doi.org/10.1136/jech.2003.015941
Tyndall, J. (2017). Waiting for the R train: Public transportation and employment. Urban Studies, 54(2), 520–537. https://doi.org/10.1177/0042098015594079
Vandecasteele, L., & Fasang, A. (2020). Neighbourhoods, networks and unemployment: The role of neighbourhood disadvantage and local networks in taking up work. Urban Studies, 58(4), 696–714. http://doi.org/10.1177/0042098020925374
Wheeler, C. H. (2007). Trends in neighborhood-level unemployment in the United States: 1980 to 2000. Federal Reserve Bank of St. Louis Review, 89(2), 123–141. https://doi.org/10.20955/R.89.123-142
Yi, C. (2006). Impact of public transit on employment status: Disaggregate analysis of Houston, Texas. Transportation Research Record, 1986(1), 137–144. https://doi.org/10.3141/1986-19
Long Descriptions
Figure 1 Long Description: Homeless population inflows include affordable housing crisis, eviction, poverty, unemployment, weak social safety net, influx from outside, mental health issues, substance use issues, conflict, and abuse from family or others. Homeless population outflows include community resources, government funding, employment, leaving Kamloops, and death. [Return to Figure 1]
Figure 2 Long Description: The flowchart progresses as follows:
- Fully integrated labour market in Kamloops?
- Are unemployment rates equal across neighbourhoods?
- If yes, long run convergence occurs (path ends here).
- If no, high unemployment regions (path continues below)
- People move to regions with better employment opportunities or people get discouraged and withdraw from labour market.
- Process equalizes unemployment rates.
- Why long-term divergence? Understand underlying causes (path ends here).

